Elven Observability: Operator Collector (Automatic Instrumentation)
In order to use auto-instrumentation, we need to install the collector operator.
Dependencies:
cert-manager
Install the operator
kubectl apply -f https://github.com/open-telemetry/opentelemetry-operator/releases/latest/download/opentelemetry-operator.yaml
- If you are going to instrument Golang applications:
					kubectl -n opentelemetry-operator-system patch deployment opentelemetry-operator-controller-manager \
--type=json \
-p='[{"op": "add", "path": "/spec/template/spec/containers/0/args/-", "value": "--enable-go-instrumentation=true"}]'
Install the collector
It is a recommended practice to send telemetry from containers to an OpenTelemetry Collector rather than directly to a backend. The Collector helps simplify secrets management, decouples data export issues (such as the need for retries) from your applications, and allows you to add additional data to your telemetry, such as with the k8sattributesprocessor component. If you choose not to use a Collector, you can skip to the next section.
https://opentelemetry.io/docs/kubernetes/operator/automatic/
Configuration example
					apiVersion: opentelemetry.io/v1beta1
kind: OpenTelemetryCollector
metadata:
  name: otel
spec:
  config:
    receivers:
      otlp:
        protocols:
          grpc:
          http:
    processors:
      memory_limiter:
        check_interval: 1s
        limit_percentage: 75
        spike_limit_percentage: 15
      batch:
        send_batch_size: 10000
        timeout: 10s
    exporters:
      otlp:
        endpoint: "tempo-distributor.domain.io:443"
        tls:
          insecure: false
          insecure_skip_verify: true
      prometheusremotewrite:
        endpoint: https://mimir-distributor.domain.io/api/v1/push
        headers:
          X-Scope-OrgID: <TENANT>
    service:
      pipelines:
        metrics:
          receivers: [otlp]
          processors: [batch]
          exporters: [prometheusremotewrite]
        traces:
          receivers: [otlp]
          processors: []
          exporters: [otlp]
- Apply the collector
kubectl apply -k otel-collector-operator/
OpenTelemetry Instrumentation
To manage auto-instrumentation, the Operator needs to be configured to know which pods to instrument and which auto-instrumentation to use for those pods. This is done through the Instrumentation CRD.
Ex. Java
					apiVersion: opentelemetry.io/v1alpha1
kind: Instrumentation
metadata:
  name: instrumentation-sample
spec:
  propagators:
    - tracecontext
    - baggage
    - b3
  sampler:
    type: parentbased_traceidratio
    argument: "1"
  env:
    - name: OTEL_EXPORTER_OTLP_ENDPOINT
      value: otel-collector.monitoring:4318
  java:
    env:
      - name: OTEL_EXPORTER_OTLP_ENDPOINT
        value: http://otel-collector.monitoring:4317
Ex. DOTNET
					apiVersion: opentelemetry.io/v1alpha1
kind: Instrumentation
metadata:
  name: instrumentation-sample
spec:
  propagators:
    - tracecontext
    - baggage
    - b3
  sampler:
    type: parentbased_traceidratio
    argument: "1"
  env:
    - name: OTEL_EXPORTER_OTLP_ENDPOINT
      value: otel-collector.default:4318
  dotnet:
    env:
      - name: OTEL_DOTNET_AUTO_METRICS_CONSOLE_EXPORTER_ENABLED
        value: "false"
      - name: OTEL_DOTNET_AUTO_TRACES_CONSOLE_EXPORTER_ENABLED
        value: "false"
      - name: OTEL_DOTNET_AUTO_LOGS_CONSOLE_EXPORTER_ENABLED
        value: "false"
      - name: OTEL_EXPORTER_OTLP_ENDPOINT
        value: http://otel-collector.monitoring:4318
      - name: OTEL_TRACES_EXPORTER
        value: "true"
      - name: OTEL_METRICS_EXPORTER
        value: "true"
Add annotations to existing deployments
The final step is to opt-in your services for auto-instrumentation. This is done by updating your services spec.template.metadata.annotations to include a language-specific annotation:
- .NET:
instrumentation.opentelemetry.io/inject-dotnet: “true” - Go:
instrumentation.opentelemetry.io/inject-go: “true” - Java:
instrumentation.opentelemetry.io/inject-java: “true” - Node.js:
instrumentation.opentelemetry.io/inject-nodejs: “true” - Python:
instrumentation.opentelemetry.io/inject-python: “true”
Test application using auto-instrumentation for JAVA
https://opentelemetry.io/docs/kubernetes/operator/automatic/
					kubectl apply -f - <<EOF
apiVersion: apps/v1
kind: Deployment
metadata:
  name: java-sample
spec:
  replicas: 1
  selector:
    matchLabels:
      app: java-sample
  template:
    metadata:
      labels:
        app: java-sample
      annotations:
        instrumentation.opentelemetry.io/inject-java: "true"
    spec:
      containers:
      - name: java-sample
        image: emr001/java-app
        ports:
        - containerPort: 8080
        env:
          - name: OTEL_SERVICE_NAME
            value: "java-demo"
---
apiVersion: v1
kind: Service
metadata:
  name: java-app
spec:
  selector:
    app: java-sample
  ports:
    - port: 8080
      protocol: TCP
      targetPort: 8080
---
apiVersion: opentelemetry.io/v1alpha1
kind: Instrumentation
metadata:
  name: instrumentation-sample
spec:
  propagators:
    - tracecontext
    - baggage
    - b3
  sampler:
    type: parentbased_traceidratio
    argument: "1"
  env:
    - name: OTEL_EXPORTER_OTLP_ENDPOINT
      value: otel-collector.monitoring:4318
  java:
    env:
      - name: OTEL_EXPORTER_OTLP_ENDPOINT
        value: http://otel-collector.monitoring:4317
  dotnet:
    env:
      - name: OTEL_DOTNET_AUTO_METRICS_CONSOLE_EXPORTER_ENABLED
        value: "false"
      - name: OTEL_DOTNET_AUTO_TRACES_CONSOLE_EXPORTER_ENABLED
        value: "false"
      - name: OTEL_DOTNET_AUTO_LOGS_CONSOLE_EXPORTER_ENABLED
        value: "false"
      - name: OTEL_EXPORTER_OTLP_ENDPOINT
        value: http://otel-collector.monitoring:4318
      - name: OTEL_TRACES_EXPORTER
        value: "true"
      - name: OTEL_METRICS_EXPORTER
        value: "true"
EOF
Restart the deployment for the operator to inject the agent via an init-container
kubectl rollout restart deployment java-sample
Perform a port-forward on port 8080 and use the loop below to send traces, metrics, and logs.
kubectl port-forward svc/java-app 8080:8080
We will create a loop to send several requests.
while true; do curl http://localhost:8080/api/hello && echo "" && sleep 1; done
Tracing Grafana
Test application using auto-instrumentation for .NET
					kubectl apply -f - <<EOF
apiVersion: apps/v1
kind: Deployment
metadata:
  name: dotnet-sample
spec:
  replicas: 1
  selector:
    matchLabels:
      app: dotnet-sample
  template:
    metadata:
      labels:
        app: dotnet-sample
      annotations:
        instrumentation.opentelemetry.io/inject-dotnet: "true"
    spec:
      containers:
      - name: dotnet-sample
        image: emr001/dotnet8-app:v1
        ports:
        - containerPort: 8080
        env:
          - name: OTEL_SERVICE_NAME
            value: "dotnet-demo"
---
apiVersion: v1
kind: Service
metadata:
  name: dotnet-app
spec:
  selector:
    app: dotnet-sample
  ports:
    - port: 80
      protocol: TCP
      targetPort: 8080
EOF
Restart the deployment for the operator to inject the agent via an init-container
kubectl rollout restart deployment dotnet-sample
Restart the deployment for the operator to inject the agent via an init-container
kubectl port-forward svc/dotnet-app 80:80
We will create a loop to send several requests.
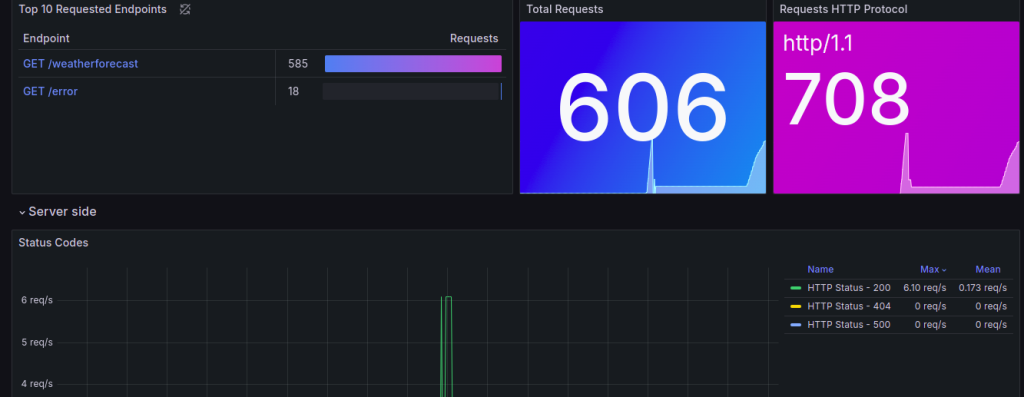
while true; do curl http://localhost/weatherforecast && echo "" && sleep 1; done
while true; do curl http://localhost/error && echo "" && sleep 1; done
Dashboard Grafana