Memcached is a widely used high-performance distributed caching system for storing and retrieving data in memory. It works as a network cache server, which temporarily stores data in RAM to provide fast responses and reduce the load on databases or other storage systems. Memcached is designed to be simple and efficient, using a key-value model, where data is identified by a unique key. It offers a command-line interface and APIs to access and manipulate cached data. With its ability to scale out, Memcached can be distributed across multiple servers to increase storage capacity and handle high traffic demands. It is widely used in web applications, especially in environments where speed and scalability are crucial, such as e-commerce sites, social media, and streaming services.

How to monitor Memcached on One Platform

1 – In the side menu, click on Services Hub


2 – In the Cache category, click on the Memcached card


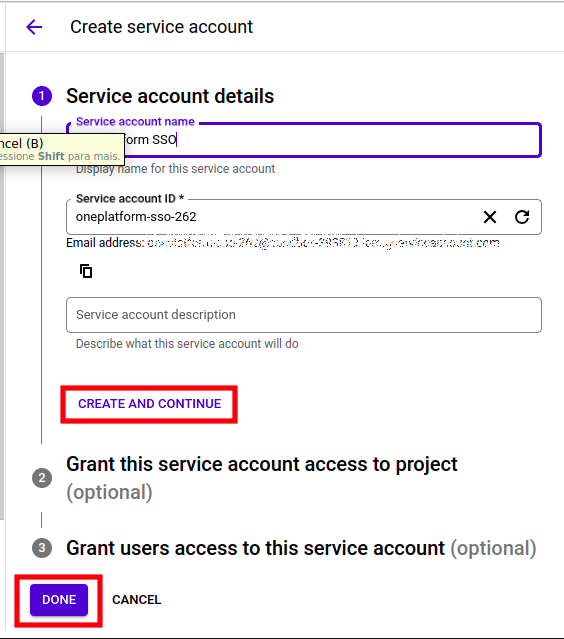
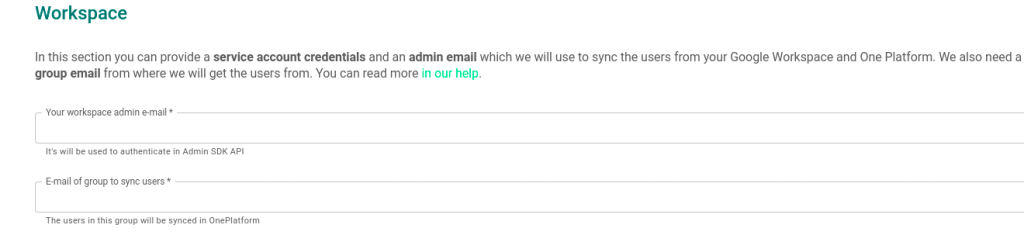
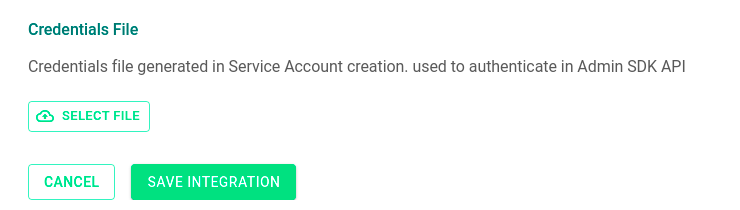
3 – You will be directed to the Memcached configuration page, fill in the fields


4 – If you want, you can configure automatic incident opening. In the Open automatic incident section, fill in the fields:

  • Severity -> Choose between “SEV-1 – Critical”, “SEV-2 – High”, “SEV-3 – Moderate”, “SEV-4 – Low”, “SEV-5 – Informational” or “Not Classified”;
  • Check Interval in seconds -> This is the interval at which checking will take place (this interval cannot be less than the number of failures x the Interval configured in the monitoring form;
  • Failures to open automatic incident -> It is the number of failures necessary to open the automatic incident;
  • Check Interval in seconds -> This is the interval in which checking will take place (this interval cannot be less than the number of hits x the Interval configured in the monitoring form;
  • Hits to close automatic incident -> It is the number of hits needed to close the automatic incident;
  • Responders -> These are the teams that will be notified if there are incidents in this monitoring, and you can add one or multiple teams;

If necessary, you can create a team by clicking + RESPONDER, you will be directed to the form

to create the team, then click on the button  for the new team to appear in the list

***Don’t forget to activate the Enable to set up automatic incidents opening toggle to save the automatic incident opening settings


5 – Click on CREATE MONITORING 


Memcached is a widely used high-performance distributed caching
system designed to store and retrieve data in memory. It operates as a
cache server in the network, temporarily storing data in RAM to provide
fast responses and reduce the load on databases or other storage
systems. Memcached is designed to be simple and efficient, utilizing a
key-value model where data is identified by a unique key. It offers a
command-line interface and APIs to access and manipulate the cached
data.

With its horizontal scalability capability, Memcached can be
distributed across multiple servers to increase storage capacity and
handle high traffic demands. It is widely used in web applications,
especially in environments where speed and scalability are crucial, such
as e-commerce websites, social media platforms, and streaming services.

How to Monitor Memcached on the One Platform

To set up monitoring for Memcached on the platform, follow these steps:

  1. Go to the product application where you want to add Memcached as a dependency in the platform.

  2. Click on the “Products” menu and select the desired product card.

  3. Then, click on the name of the specific application where you want to configure Memcached monitoring.

  4. Look for the section called “External Dependencies,” usually located just below the latency graph of the application.

  5. To add an already registered dependency, type the name of the
    dependency in the search field and select it when it appears in the
    list.

  6. If Memcached is not yet registered as a dependency, click on the green button with a plus (+) symbol to add a new dependency.


Click “Add” and a modal will
appear allowing you to name the database and select the Environment. In
the “Check type” field, choose the option “DB,” and in the “Method”
field, select “Memcached.” After selecting the method, a field for the
Healthcheck URL will appear.


Below is an example of string for Memcached:

example: HOST:PORT


Note: For security reasons, it is not permitted to enter an IP in the
healthcheck field. To monitor an IP, you need to enter it in a secret
and use it in healthcheck

There are two ways to validate an HTTP request on the platform. The
first is called “status code,” where we check if the response status
code belongs to the 200 family (for example, 200, 201, 204, etc.),
indicating a successful response.

The second way is by using “String Validation,” which can also accept
a Regular Expression. Regular Expressions are patterns of characters
that associate character sequences in text. We can use regular
expressions to extract or replace portions of text( such as an email
address or image link in an HTML page), modify the text format, or
remove invalid characters. This way, you can perform more complex checks
on HTTP response data.This allows you to perform more detailed and
precise validations, such as the example below.

If your API returns:

{

status: 1,

name: xyz

}

Any non-zero status result is considered valid, so you would define as:

String Validation:

status: [^0]

For more details on how to use Regular Expressions you can check out the GoLang documentation.

Lambda is a serverless computing service provided by Amazon Web Services (AWS). It allows you to run code scalably and reliably without needing to provision or manage servers. With Lambda, you can create functions that are triggered by events, such as changes to S3 buckets, updates to DynamoDB tables, messages received in the SQS queue service, and more. Each function runs in an isolated environment and automatically scales according to demand, eliminating the need for manual scaling. Additionally, Lambda supports multiple programming languages, including Python, Node.js, Java, C#, and Go, allowing you to choose the language you prefer. With its flexibility and scalability, Lambda is widely used for building microservices architectures, processing real-time events, creating serverless APIs, and automating tasks, making application development more agile and efficient.

How to monitor Lambda on One Platform

1 – In the side menu, click on Services Hub


2 – In the Serverless category, click on the Lambda card


3 – You will be directed to the AWS Lambda configuration form, fill in the fields


4 – If you want, you can configure automatic incident opening. In the Open automatic incident section, fill in the fields:

  • Severity -> Choose between “SEV-1 – Critical”, “SEV-2 – High”, “SEV-3 – Moderate”, “SEV-4 – Low”, “SEV-5 – Informational” or “Not Classified”;
  • Check Interval in seconds -> This is the interval at which checking will take place (this interval cannot be less than the number of failures x the Interval configured in the monitoring form;
  • Failures to open automatic incident -> It is the number of failures necessary to open the automatic incident;
  • Check Interval in seconds -> This is the interval in which checking will take place (this interval cannot be less than the number of hits x the Interval configured in the monitoring form;
  • Hits to close automatic incident -> It is the number of hits needed to close the automatic incident;
  • Responders -> These are the teams that will be notified if there are incidents in this monitoring, and you can add one or multiple teams;

If necessary, you can create a team by clicking + RESPONDER, you will be directed to the form

to create the team, then click on the button  for the new team to appear in the list

***Don’t forget to activate the Enable to set up automatic incidents opening toggle to save the automatic incident opening settings


5 – Click on CREATE MONITORING 


Lambda is a serverless computing service provided by Amazon Web
Services (AWS). It allows you to execute code in a scalable and reliable
manner without the need to provision or manage servers. With Lambda,
you can create functions that are triggered by events, such as changes
in S3 buckets, updates in DynamoDB tables, messages received in the SQS
queue service, among others. Each function runs in an isolated
environment and automatically scales based on demand, eliminating the
need for manual scaling. Additionally, Lambda supports multiple
programming languages, including Python, Node.js, Java, C#, and Go,
allowing you to choose your preferred language. With its flexibility and
scalability, Lambda is widely used for building microservices
architectures, real-time event processing, serverless API creation, and
task automation, making application development more agile and
efficient.

How to monitor Lambda on the One Platform:

  1. Go to the product application where you want to add Lambda as a dependency.
  2. Click on the “Products” menu.
  3. Click on the desired product card.
  4. Click on the name of the desired application.
  5. In “External Dependencies,” located below the latency chart, you can add or search for an already registered dependency.
  6. To search for a dependency, enter its name in the search field.
  7. To add a new dependency, click on the green button with a plus symbol (+).


When you click on “Add,” a modal will appear. In this modal, you will
name your queue and choose the Environment. In the “Check type” field,
select the option “Queue,” and in the “Method” field, choose “Lambda
(AWS).” After selecting the method, a field for “Healthcheck URL” will
appear.


Check the checkbox NAME for Lambda monitoring.

Below is an example string for Lambda:

ex: ACCESS_KEY:SECRET_ACCESS_KEY/AWS-REGION@functionName

We use the AWS CloudWatch API to search for Lambda logs and metrics. Click here to read more about their pricing.


Note: For security reasons, it is
not permitted to enter an IP in the healthcheck field. To monitor an IP,
you need to enter it in a secret and use it in healthcheck

Kafka is an open-source event streaming platform designed to handle massive streams of data in real-time. It offers a distributed architecture, high scalability and fault tolerance, allowing large volumes of data to be processed and transmitted efficiently and reliably. In Kafka, data is organized into topics, which are divided into partitions distributed among Kafka brokers. Producers publish logs to topics, and consumers can subscribe to receive these logs in real time. This makes Kafka ideal for use cases such as real-time event processing, batch data ingestion, asynchronous messaging, systems integration, and data pipeline. With its high throughput and low latency, Kafka has been widely adopted by enterprises to build scalable and distributed data architectures, enabling real-time analytics, streaming processing, and building high-performance applications.

How to monitor Kafka on One Platform

1 – In the side menu, click on Services Hub


2 – In the Queue category, click on the Kafka card


3 – You will be directed to the Kafka configuration form, fill in the fields


4 – If you want, you can configure automatic incident opening. In the Open automatic incident section, fill in the fields:

  • Severity -> Choose between “SEV-1 – Critical”, “SEV-2 – High”, “SEV-3 – Moderate”, “SEV-4 – Low”, “SEV-5 – Informational” or “Not Classified”;
  • Check Interval in seconds -> This is the interval at which checking will take place (this interval cannot be less than the number of failures x the Interval configured in the monitoring form;
  • Failures to open automatic incident -> It is the number of failures necessary to open the automatic incident;
  • Check Interval in seconds -> This is the interval in which checking will take place (this interval cannot be less than the number of hits x the Interval configured in the monitoring form;
  • Hits to close automatic incident -> It is the number of hits needed to close the automatic incident;
  • Responders -> These are the teams that will be notified if there are incidents in this monitoring, and you can add one or multiple teams;

If necessary, you can create a team by clicking + RESPONDER, you will be directed to the form

to create the team, then click on the button  for the new team to appear in the list

***Don’t forget to activate the Enable to set up automatic incidents opening toggle to save the automatic incident opening settings


5 – Click on CREATE MONITORING 


Kafka is an open-source event streaming platform designed to handle
massive streams of real-time data. It offers a distributed architecture,
high scalability, and fault tolerance, enabling efficient and reliable
processing and transmission of large volumes of data. In Kafka, data is
organized into topics, which are divided into partitions distributed
among Kafka brokers. Producers publish records to topics, and consumers
can subscribe to receive these records in real-time. This makes Kafka
ideal for use cases such as real-time event processing, batch data
ingestion, asynchronous messaging, system integration, and data
pipelines. With its high throughput and low latency, Kafka has been
widely adopted by companies to build scalable and distributed data
architectures, enabling real-time analysis, continuous stream
processing, and high-performance applications.

How to Monitor Kafka on the One Platform

To set up monitoring for Kafka on the platform, follow these steps:

  1. Go to the product application where you want to add Kafka as a dependency on the platform.

  2. Click on the “Products” menu and select the desired product card.

  3. Then, click on the name of the specific application where you want to configure Kafka monitoring.

  4. Look for the section called “External Dependencies,” usually located just below the latency graph of the application.

  5. To add an already registered dependency, type the name of the
    dependency in the search field and select it when it appears in the
    list.

  6. If Kafka is not yet registered as a dependency, click on the green button with a plus (+) symbol to add a new dependency.


When you click on “Add,” a modal will appear. In this modal, you will
name your queue and choose the Environment. In the “Check type” field,
select the option “Queue,” and in the “Method” field, choose “Kafka.”
After selecting the method, a field for “Healthcheck URL” will appear.


To perform this step, the responsible person needs to understand how
the Kafka cluster operates and what type of checks they want to perform.
Below are the examples of strings for Kafka checks:

There are four ways to check the Kafka cluster:

  1. Connection without authentication and a simple check of a specific topic for the platform: HOST:PORT/TOPIC

  2. Connection without authentication and a simple check of a specific topic for the platform, but with a list of brokers: [HOST1:PORT,HOST2:PORT]/TOPIC or HOST1:PORT,HOST2:PORT/TOPIC

  3. Connection without authentication and verification of message
    consumption delay size for a topic (Production) from the perspective of a
    consumer group: [HOST:PORT]/TOPIC/CONSUMER-GROUP/LAG-TOLERANCE

  4. Connection with SASL authentication and simple (or non-simple) verification: USER:PASSWORD:MECHANISM:TLS:SASL@[HOST1:PORT,HOST2:PORT]/TOPIC or USER:PASSWORD:MECHANISM:TLS:SASL@[HOST1:PORT,HOST2:PORT]/TOPIC/CONSUMER-GROUP/LAG-TOLERANCE

Example of a verification string for the example 4:

kafka:{{.kafka_password}}:SCRAM-SHA-512:true:true@[b-2.kafka-production.amazonaws.com:9096,b-1.kafka-production.amazonaws.com:9096,b-3.kafka-production.amazonaws.com:9096]/eventos/consumidor-de-eventos/200


Note: For security reasons, it is not permitted to enter an IP in the
healthcheck field. To monitor an IP, you need to enter it in a secret
and use it in healthcheck

Typically used for login, this monitoring is used to, in some specific scenarios, do two-step verification. A application makes a prerequisite and a postrequisite, using the response from the first request to completing the second request at a URL and check whether the digital product is up or down, using several flows.


SSO Configuration with SAML (Single Sing-On)


1 – In Google Workspace, go to Apps > Web and mobile apps

2 – Select Add app > Add custom SAML app


3 – Fill in the following data: 

  • App name: OnePlatform (Suggested name)
  • Description: (Optional) 
  • App Icon: (Optional) OnePlatform Icon 


Click CONTINUE

4 – Copy the Entity ID and download the Certificate. Click CONTINUE


5 – Open OnePlatform in a new tab, click on Settings Organization


6 – Select the Single Sign-On tab


7 – Fill in the Sign In URL field with the Entity ID copied in step “4” and select the downloaded Certificate file


8 – Copy the following data obtained from OnePlatform:
  • ACS URL
  • Entity ID


9 – Paste the copied data into the corresponding fields in Workspace, as shown in the image below.


10 – Choose the format you want for the app name (First name, Last name or Primary e-mail) and click CONTINUE


11 – Open the created app and click on User Access


12 – Enable access for Workspace users to use this app. Users who are enabled will be able to log in to OnePlatform

  • If you to release it to all workspace users, select ON for everyone and click in SAVE


  • If you want, configure a specific group in your workspace and, by clicking on Group, select the desired group, then activate the ON switch and click on SAVE


13 – Wait until the App created to access OnePlatform appears. This may take a few minutes 


Configuration for user synchronization on OnePlatform


1 – Enter the Google Cloud, select the menu through the 3 bars located in the top left corner, select IAM & Admin > Service Accounts


2 – Click Create Service Account 


3 – Fill the fields with the data, click on Create and Continue then on Done

  • Service Account Name: Oneplatform SSO  (Suggested name)
  • Description: (Optional)

4 – Open the created service account and select the KEYS, click ADD KEY and Create new key

5 – Select the key type as JSON, click CREATE.

***store in a safe place 

6 – Select the Details tab and click on Advaced settings

7 – Write down the Client ID, as it will be used in future steps

8 – In your Workspace Administrator panel, in the lefr menu, select Security> Data and access control > API Controls

9 – Click on MANAGE DOMAIN WIDE DELEGATION 

10 – Click on Add new 

11 – In the Client ID field, fill in the valuue noted in step “7”

12 – In the OAuth scopes
field, fill in these values on each line (place each link separately,
for each one added, the field to add the next one will appear):

  • https://www.googleapis.com/auth/admin.directory.group.readonly -> View groups on your domain
  • https://www.googleapis.com/auth/admin.directory.group.member.readonly –> View group subscriptions on your domain
  • https://www.googleapis.com/auth/admin.directory.user.readonly –View information about users in your domain

***If you want to check the level of access you are allowing, access the link

13 – Click on AUTHORIZE

14 – Access the Google Cloud Console, in the left menu, access APIs & Sesvices > Library

15 – Search for Admin SDK API

16 – Click on Enable 

17 – Return to the SSO settings screen on OnePlatform and fill in the fields:

  • Workspace admin e-mail -> email with admin access to the workspace
  • E-mail of group to sync users ->
    e-mail of the group configured to synchronize users with OnePlatform
    (if you selected activate for the entire workspace, use a group that
    contains all users)

18 – Further down in Credentials File, select the JSON saved with the keys created in step “5”, clicking on SELECT FILE

19 – Click on SAVE INTEGRATION and it is configured.

Observation:

All the following steps must be done after the External
Integration (GoogleCloud) has already been configured by the ElvenWorks
team.


1 – In your Google Cloud Monitoring, in the left side menu, go to Alerting:


2 – In the center of the screen, click on EDIT NOTIFICATION CHANNELS:


3 Scroll down to Webhooks and click on ADD NEW:


4 – A screen will open to add:
– Endpoint URL: API URL
– Display Name: enter the name of your choice After filling out, click save.


Ready, your channel has been created and can be linked to any monitoring to be alerted via OnePlatform.

Scroll to Top