Creating an API Token

To create an API Token on the platform:
2 – In the API tab, click the “+” button to create a new API Token

3 – Select the type API Token and fill in the Name field. Then, click on Generate Integration Token.

Creating an External Service Zabbix

1 – Go to the Service Hub, located in the left sidebar menu.

2 – Select from the options: if you want to open an alert, choose Alert Zabbix; if you want to open an incident, choose Incident Zabbix.

3 – In the form, fill in the External service name and the Responders who will receive notifications from this service. Then, click CREATE.


4 – Further down, the information for your External Service will appear, requesting you to select an API token. Choose the one created earlier.

5 – After selecting the API token, the necessary information to configure the External Service Zabbix is complete.


6 – After being created, your External Services will appear in the External Services Monitoring Center

Configuring in Zabbix


  • Supported Zabbix versions: 5.0.1 – 6.0.1 – 6.0.19 – 6.0.21

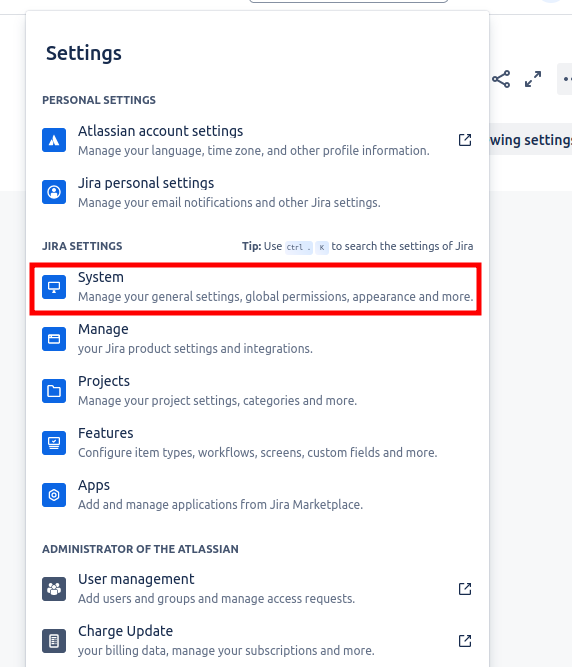
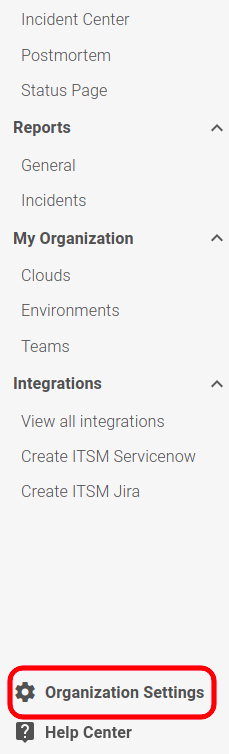
1 – In Zabbix, in the menu on the left, go to Administration and click on Media types:


2 – Click Import in the top right corner of the screen and select the Zabbix version configuration file:


3 – After selecting the file, select the Create new option and click Import:


4 – Then go back to Media types and select One Platform that was created:


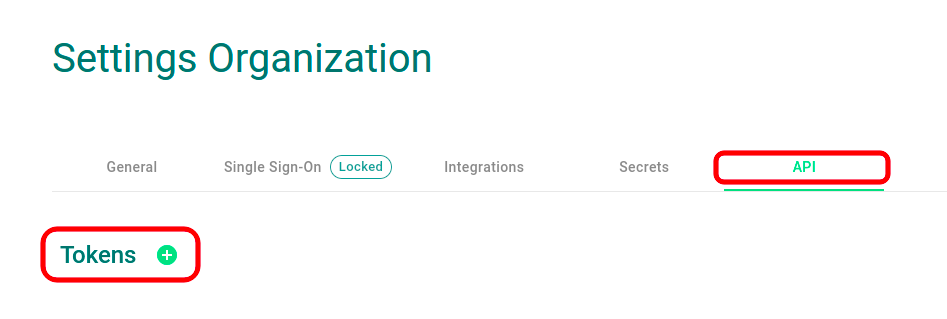
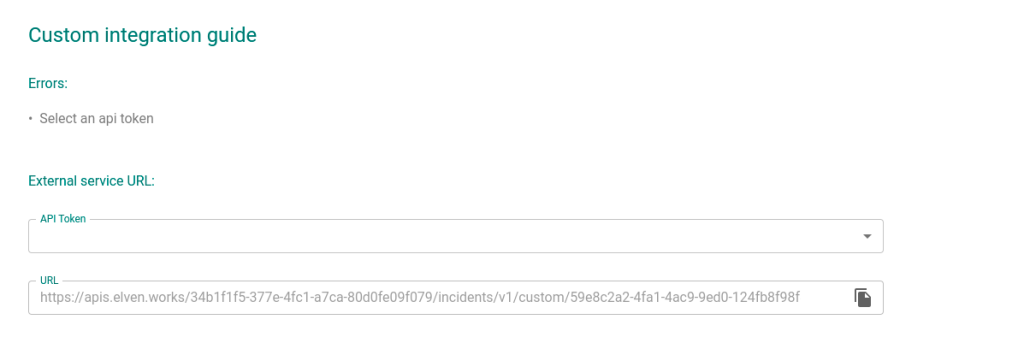
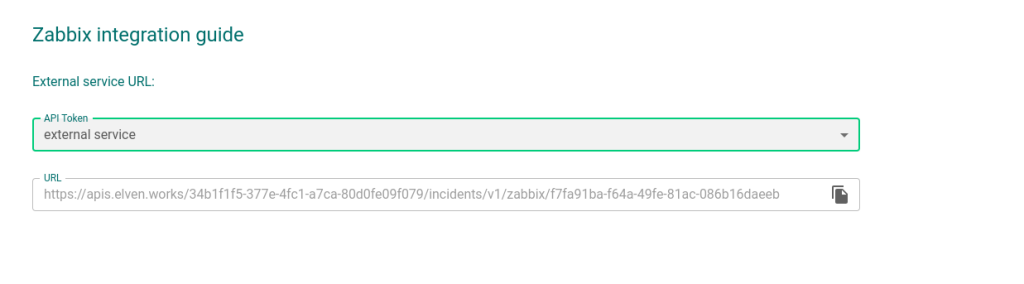
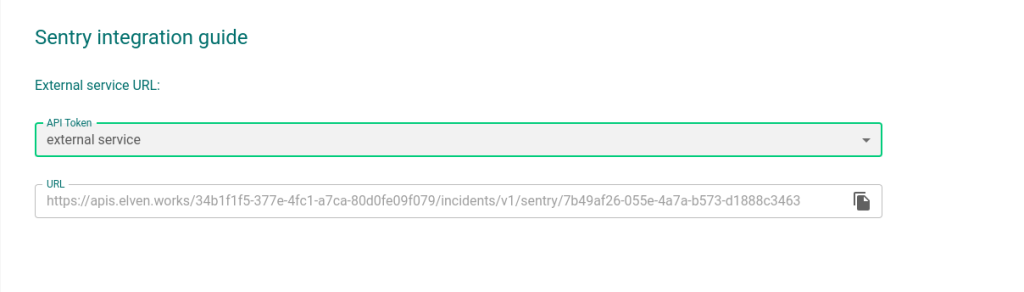
5 – Configure the fields with the data that was passed through External Integration:


Where is <PLACE YOUR ONE PLATFORM>, change to data:


one_platform_organization: Organization uID

one_platform_url: API URL


After configuring, click Update.

6 – In the left menu, go to Administration and click on Users:


7 – Select the Admin user and go to Media:


8 – Click on Add and configure the Media:


Type: One Platform

Send to: One Platform

8.1 – Click on Add and then click on Update:


Steps 8 and 8.1 must be done for all configured users for whom you want to release the Media type.

9 – In the left menu, go to Configuration, click on Actions and Trigger Actions:


10 – On the Action tab, give the action a name and, in Conditions, click Add:


10.1 – Select the type according to your settings: (ex: Host/Host Group)


10.2 – Click Add.


11 – In the Operations tab, click Add:


11.1 – Configure the desired operation for your Action trigger:


12 – The same procedure must be done in the Recovery Operations field:


12.1 – Click on Add in the Operation details window and then on Add again to add the Trigger action.

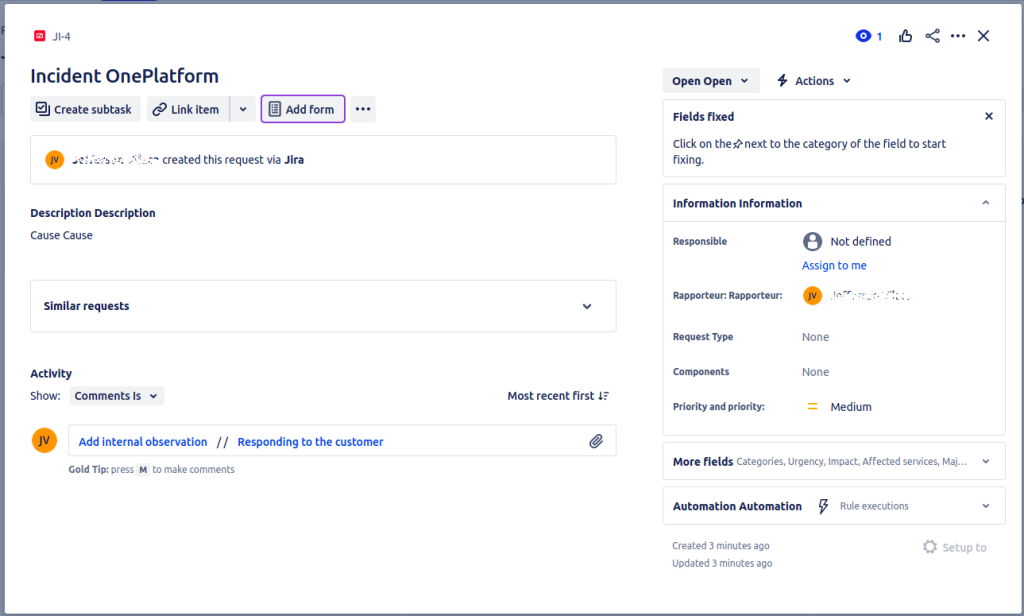
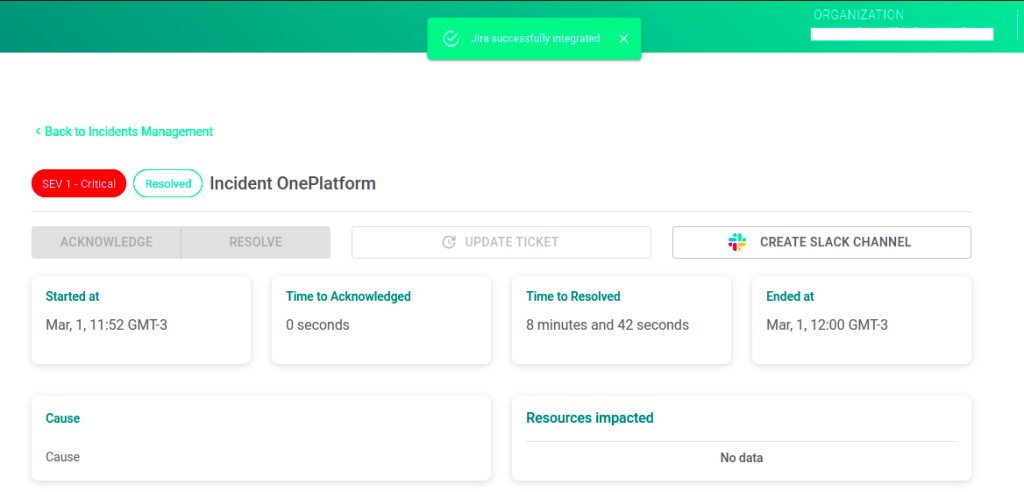
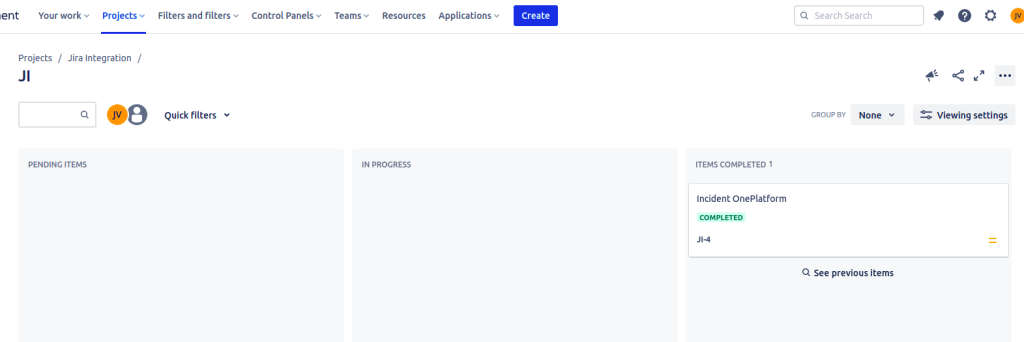
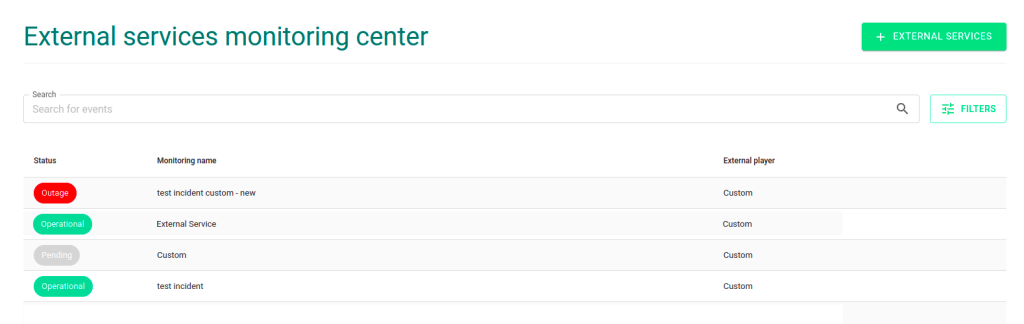
13 – Done! Your Zabbix is already integrated with our 1P platform. Whenever there is a problem, it will be alerted on the platform in the Incidents tab and, when resolved, the Incident will be considered Resolved.

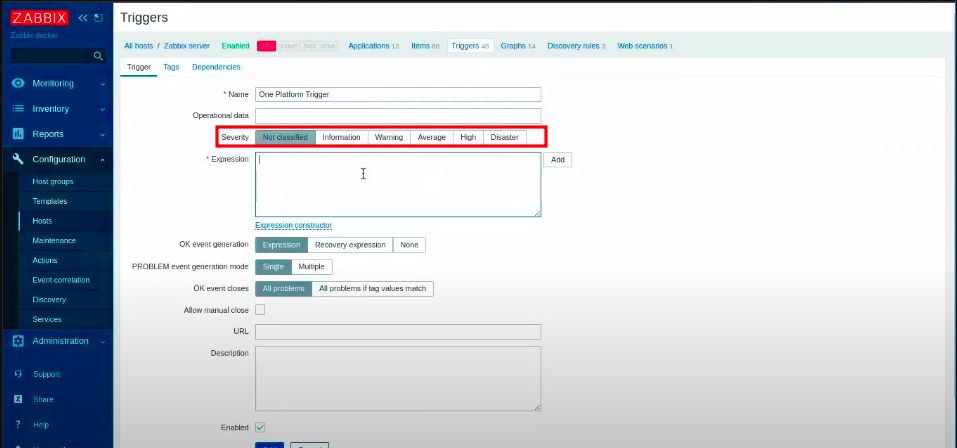
Add severity to Zabbix integration

To configure the severity of the incident, go to the settings menu, under “hosts” and click on “triggers”


Go to the trigger you want to add the severity to or create a new one and choose one of the available options.

The severity will appear in the standard used by One Platform:

information = informational
warning = low
average = moderate
high = high
disaster = critical

Integrate with Servicenow and open tickets for your incidents quickly and efficiently through the One Platform. To get started, click “Create ITSM Servicenow” in the left menu.


Fill in the form with the information provided by Servicenow.


After completing the registration, in the “View all integrations” menu, on the left side, your integration should appear.


Done! You can now open tickets in Servicenow from the incident screen on One Platform.

To open the ticket on Servicenow, click on the “OPEN TICKET” button on the incident screen.


After this, a ticket will be opened on Servicenow regarding the incident opened at 1P


Changes made to 1P (for example: acknowledge, title, description, etc.) will be reflected in the Servicenow ticket.


When the incident is resolved at 1P, this will be reflected in the Servicenow ticket.

image (4).png

Creating an API Token

To create an API Token on the platform:
2 – In the API tab, click the “+” button to create a new API Token

3 – Select the type API Token and fill in the Name field. Then, click on Generate Integration Token.

Creating an External Service Sentry

1 – Go to the Service Hub, located in the left sidebar menu.

2 – Select from the options: if you want to open an alert, choose Alert Sentry; if you want to open an incident, choose Incident Sentry.

3 – In the form, fill in the External service name and the Responders who will receive notifications from this service. Then, click CREATE.


4 – Further down, the information for your External Service will appear, requesting you to select an API token. Choose the one created earlier.

5 – After selecting the API token, the necessary information to configure the External Service Sentry is complete.

Configuring in Sentry

1. Primeiro clique em “Settings” e em seguida em “Integrations”


1. First click on “Settings” and then on “Integrations


2. Search for “Webhook” in the search bar

3. Click on “Add to Project” (If you have more than 1 project, choose which one you want to create the integration for)

4. In the “Callback URLs” field, enter the URL provided by the ElvenWorks team, click on “Save Changes” and then click on “Enable Plugin

5. To test the integration, you can click on “Test Plugin” (An incident must be created on OnePlatform)

6. To link the webhook to an alert, enter the conditions configuration and, in the “THEN” field, select “send notification via an integration”, then choose the “WebHooks” option


Ready! Your integration with Sentry is already configured.

Note:

All the following steps
should be performed after the External Integration has already been
configured by the ElvenWorks team. Request the integration through the
chat on the platform or website. Remember, at the time of the request,
specify whether you would like to open an incident or an alert with the
integration, as well as the team to be notified.


1 – Configure the Receiver.

In the Prometheus Values, in the
Receivers section, configure the necessary receivers (with the
information provided by the ElvenWorks team).


2 – Configure the Routes

In the Prometheus Values, in the routes section, configure them as follows:

route:
group_wait: 30s
group_interval: 5m
repeat_interval: 5m
receiver: 1p-webhook # Name configured in the previous step
routes:
- receiver: 1p-webhook # Name configured in the previous step


3 – Configure the Alerts

In the Prometheus Values, in the
alerts section, configure the necessary alerts (with the information
provided by the ElvenWorks team).

- name: Instances GoLang
rules:
- alert: <Title of the incident/alert>
expr: <metrics expression>
for: <Error duration time>
annotations:
description: "<Description of the incident/alert>"
labels:
 severity: <choose between critical, high, moderate, low, or informational>

There you go, your integration with Prometheus is now configured.

Observation:

All of the following steps must be done after External
Integration has already been configured by the ElvenWorks team. Request
integration via chat on the platform or on the website.


1 – In NewRelic, in the menu on the left, go to Alerts & AI and click on Alert Conditions & Policies:


Create a new Alert Policy:


Select One Issue per condition and signal


Finish by clicking on Create policy whithout notifications.


2 – In the menu on the left, click on Workflows and then in the top right corner of the screen and select Add a workflow:


3 – Give the workflow a name of your choice and select the Policy created in step 1:


4 – In Notify select Webhook and then Add a destination:


Put your preferred ID name in Webhook name


In Endpoint URL: enter the url provided by the ElvenWorks team


After filling out, click on Save destination.


Fill in the information sent by the ElvenWorks team:


After inserting the payload provided by the ElvenWorks team, click on Save message

Once this is done, your integration with One Platform will be available.

A Jira integration can truly transform the way a team works,
improving collaboration, efficiency, and product quality. By eliminating
data silos, automating repetitive tasks, and providing a unified
project view, teams can focus more on meaningful work and less on tool
administration. It is an investment that can bring great returns in
terms of productivity and project success. Follow the steps below to
integrate Jira with OnePlatform.


1 – Integrate with Jira and open tickets for your incidents quickly
and effectively through the One Platform. To get started, click on
“Create ITSM Jira” in the left menu.


2 – Fill out the form with the necessary information.


The fields are:

  • Integration Name – Integration name of your choice
  • Default Jira Lenguage – Choose the default language just like it is in Jira
  • Subdomain – Subdomain provided by Jira
  • Project Key – You get this information in the project settings or in the top corner of your project dashboard. In this example the key is “JI”. This Key is configured when the project is created
  • Username – Username/email used to log in to Jira
  • Api Token – This token is obtained through the account settings

2.1 – To check the Jira language, click on the “gear” located in the top right corner and then on “System

2.2 – To get the Api Token, click on the “gear” located in the top right corner and then on “Atlassian account settings”


2.3 – In the “Security” tab, click “Create and manage API tokens


2.4 – Click in “Create an API token


2.5 – Name it and click “Create


Your token has already been created and ready to use on OnePlatform.

Note: If you want, you can place the teken in a secret by clicking on the “key” in the field “Api Token


3 – The supported template for this integration is “Management of IT services” (note that only Atlassian account admin users have permission to create this type of template)


4 – After configuring the integration within OnePlatform, the “OPEN TICKET” button will appear on the incident screens


5 – When the incident is opened, you can open a ticket regarding this incident in Jira by clicking the button “OPEN TICKET“, a success message will appear on the screen


6 – At this point, a ticket will be opened in Jira

7 – After the incident is resolved, you can click on “UPDATE TICKET” and it will be moved to the column “ITEMS COMPLETED

8 – If you want to edit or delete the integration on OnePlatform, click on “View all integrations” in the left menu, all integrations configured on the platform will appear

Captura de tela de 2024-05-15 14-46-48

9 – Go to “Jira Integration“, click on the action you want (delete or edit)

To open a card in Jira through an alert or incident on One Platform,
simply add the email configured for opening cards in Jira to a team on
One Platform.


When an incident or alert (can be automatic, originating from an
external integration, opened manually, etc.) linked to this team is
opened


A card will automatically be opened in Jira.


Note: When the incident/alert is resolved, a new email will be sent, thus opening a new card that can be deleted.

Observation:

All of the following steps must be done after External
Integration has already been configured by the ElvenWorks team. Request
integration via chat on the platform or on the website.


1 – In Grafana, in the left menu, go to contact point and click Add contact point


Name: 1p-Elvenworks

Integration : Select “Webhook”

URL: Request the URL from the ElvenWorks team via chat on the platform


Observation:

All the following steps must be done after the External Integration (Custom) has already been configured by the ElvenWorks team and the following data has been provided: API URL, Header (HEADER) and Payload. Request integration via chat on the platform or on the website.


1 – In your Elastic Cloud, go to Stack Management:


2 – In the Alerts and Insights part, click on Connectors:


3 – Click on Create Connector and select Webhook. Configure it with the data that was generated by External Integration:


Connector Name: Name of the Connector you want to create

Method: POST

URL: <API_URL generated when creating the External Integration>

Authentication is not required and the option can be unchecked


Check the ADD HTTP HEADER option:

Key: User-Agent

Value: 1PcustomAuth/1.0


Click on Save & Test.

4 – On the next screen, paste the payload generated by External Integration into BODY:


title: Title of the Incident that will appear on 1P

description: Description of the Incident that will appear on 1P

external_aggregate_key: Incident Identifier (If you want to have N Monitors for the same integration)

action: Type of action (Alarmed or Resolved)

organization: 1P Organization ID


Once configured, click Run.


Ready, your Elastic Cloud + 1P integration is created and a Test Incident notification will arrive on the Platform. Remembering that this Connector configuration in Elastic Cloud follows the configurations that are in your Alerting Rules.

Observation:

All of the following steps must be done after External
Integration has already been configured by the ElvenWorks team. Request
integration via chat on the platform or on the website.


Open Dynatrace and, in the left menu, go to Manage > Settings:


2 – Select Integration and then Problem Notification:


3. Click Add Notification and let’s configure a new notification.


3.1 – In Notification Type, select Custom Integration.


3.2 – Give the notification a name in Display Name.


3.3 – In Webhook URL, enter the URL provided by the ElvenWorks team.


3.4 – Leave the Call Webhook if problem is Closed active.


3.5 – Add an HTTP Header, passing Name User-Agent and Value 1PCustomAuth/1.0.


3.6 – In the Custom Payload field, paste the payload provided by the ElvenWorks team.


Payload Example:

{

  “title”: “{ProblemTitle}”,

  “description”: “{ProblemDetailsText}”,

  “external_aggregate_key”: “{Pid}”,

  “action”: “{State}”,

  “organization”: “<ORG_UID>”,

  “severity”: “”

}


The “severity” field must be filled in with the following values:

  • critical
  • high
  • moderate
  • low
  • informational
  •  

3.7 – Select the Alerting Profile you want notifications to be generated.


After that, just save and that’s it, your integration is done. All
incidents generated in Dynatrace related to the configured Alerting
Profile will also arrive and notify on the One Platform.

Scroll to Top