Welcome to the Elven Platform – your complete solution for Monitoring, Incident Management and Status Pages. This guide is designed to ensure that you not only join the platform, but have an exceptional experience from the very first moment. Get ready to start a journey that will exceed all your expectations!
1. Registration and Initial Configuration
Organization registration:
- Access Sign Up
- Fill in your basic information using a corporate email and click “Sign Up”
- Name your organization, accept the Terms and Conditions and click “Start Now”
- Confirm your email to activate your account.
- Note: remember to put the sender @elven.works as trusted so you don’t miss any type of notification or alert.
Initial Organization Setup:
- Log in to your new account
- Complete your registration including your phone number
- Invite your team to join you, ensuring smooth onboarding from the start
- Configure which permission role each member of your team can have access to
2. Exploring the main modules
The Elven Platform offers three main modules, each designed to meet your organization’s unique needs. Check out each of them below and, if you have any questions, our team is here to help you choose the module that best suits your specific goals and challenges. Click here and let’s talk and find the ideal solution for you!
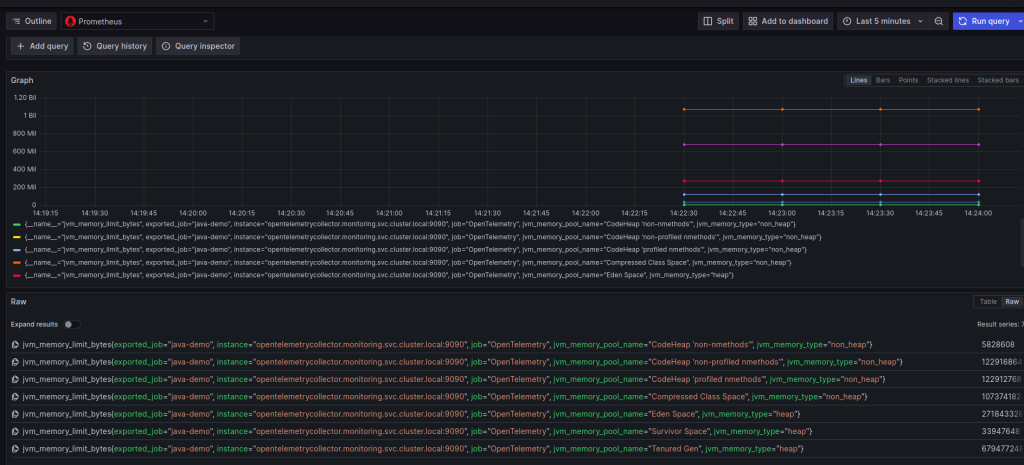
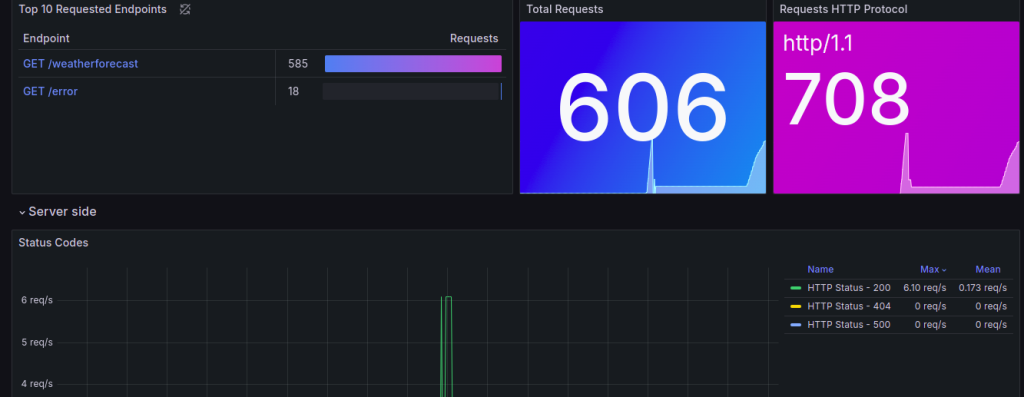
Monitoring Module:
Proactive, customizable solution for tracking the health and performance of systems and applications.
- Start by choosing the type of monitoring and configure it by clicking here
- Understand the resource screen by clicking here
- Analyze the resource metrics by clicking here
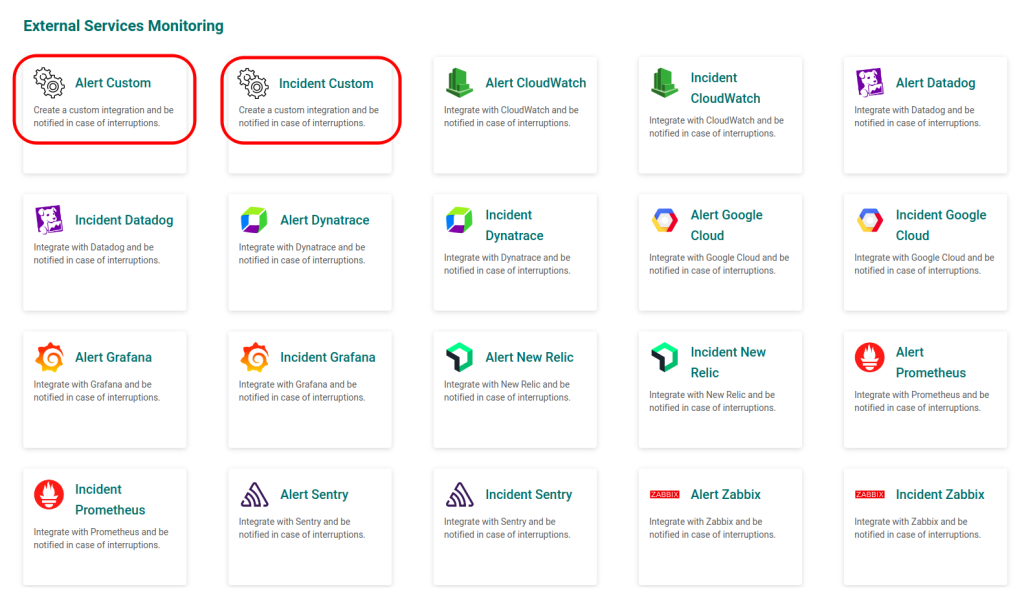
Incident Management and Response Module:
In real time, the Elven Platform receives the alert event or incident, triggers the on-call schedule, notifies through communication channels and records all interactions within the platform until resolution.
- Start configuring your team by clicking here
- Choose the channels you want to be notified by clicking here
- Configure call rotation by clicking here
- Understand the incident screen by clicking here
- Create a postmortem of the incident by clicking here
Status Pages Module:
Customized Status Pages to keep users informed about the status of services or applications via SMS or Webhook, with availability uptime and incident history.
- Start by configuring your Status Page here
3. Subscription
4. Support and Continuous Improvement
- Explore our extensive knowledge base to find answers to your most common questions. clicking here
- Contact our dedicated support team at any time for efficient assistance via email at support@elvenworks.atlassian.net or Ticket Opening Tool
- Send us your feedback and suggestions to contact@elven.works for continuous improvements
Now that you’re ready to get started, get ready to embark on a journey of unprecedented success and reliability with the Elven Platform. We are honored that you chose our platform and are here to support you every step of the way.m