Some of the monitoring features on the platform require the setup of a Cloud environment, such as:

  1. An external application with an Elvenworks agent.
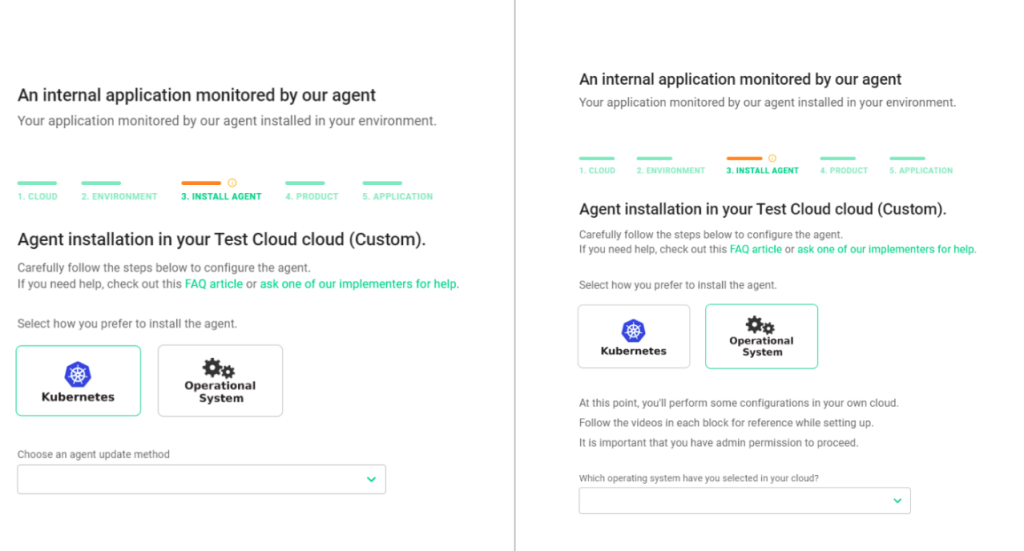
  2. An internal application monitored by our agent.
  3. Internal application with an authentication request flow.

Below, you’ll find instructions on how to perform this configuration.

First, choose whether you would like to use an existing cloud (Existing Cloud) or create a new cloud (New Cloud). If you select an existing cloud, pick one of the options you’ve already configured and click “Go to Environment.” However, if you want to set up a new cloud, you need to assign a name to it and select your preferred provider.

To select the provider, you’ll need to add a policy. Here’s how to add the policy to your chosen provider:

  • AWS (automatic integration)
  • Azure (automatic integration)
  • Custom (Linux OS)
  • K8s: Kubernetes (auto-update and manual-update)

Once you’ve selected your provider and filled in the necessary access fields (for AWS and Azure), click the “Validate Cloud and configure Environment” button.


Setting up an “Agent Environment”:

To configure an environment, you need to choose either a new environment (New Environment) to start the agent installation or an existing environment (Existing Environment) to continue the configuration. In a new environment, follow these steps:

  1. Assign a name in the designated field.
  2. Select the region and Virtual Private Cloud (VPC) where the agent will be provisioned (these should be the same as the infrastructure).
  3. Choose a Subnet that has internet access to associate with the agent.

You also need to select one of the three types of machines listed in the options, with the quantity varying depending on the registered applications, and assign a TAG according to your preference. Finally, validate the environment and install the agent by clicking the “Validate environment and install agent” button.


Setting up a Custom “Agent” Environment:

To configure a custom environment, follow these steps:

  1. Assign a name in the designated field.
  2. Assign a TAG according to your preference.
  3. Finally, validate the environment and install the agent by clicking the “Validate environment and install agent” button.


To continue the cloud configuration and agent installation of your operating system or using Kubernetes, you can follow the tutorials provided in the following links:

  • Custom (Linux OS). 
  • K8s: Kubernetes (Auto-update and Manual-update) 

The Call Rotation is a feature designed to distribute notifications
in case of on-call workers, team escalation, and notifications via SMS
and phone calls. This feature is configured per team and will be
triggered in case of an incident for all products monitored by that
specific team.

In the platform, the Call Rotation works in parallel with the
pre-configured notification channels in the “Notifications” tab, located
in your team’s area, under the “Teams” section in the left menu.
However, this feature is exclusive for SMS and phone calls.

Before starting the Call Rotation escalation configuration, the users registered in the team must have their mobile numbers validated on the platform. If their numbers are not validated, they will not receive notifications.

Accessing the team:

To begin the Call Rotation configuration, you need to access your team. There are two different ways to do this:

  1. The first way is to access your team through the “Product” section.
    Go to the left menu, click on “Product,” and then select the product
    associated with the team you want to configure. In the top bar, click on
    the “Teams” tab and select the desired team. You will be directed to
    the team’s configuration page.


Tip: If you access the team through the Product
section, it does not mean that the Call Rotation escalation will be
configured only for the selected product. The configuration is done for
each team, and if the team is assigned to another product, the incident
notification for the other assigned products will also be included in
the Call Rotation escalation. This access is only to locate the desired
team.

The second way is to click on “Teams,” located in the left menu, and select the team you want to configure.


Setting up the team roster

Once you are on the configuration
page of the selected team, select the “Call Rotation” tab in the top
bar. As you enter the tab, you will see a calendar, as the escalation is
done through “events” that can be scheduled on a daily, weekly, or
monthly basis.


You can create an individual event
for a day by clicking on the desired date on the calendar.
Alternatively, you can hold and drag the mouse cursor from the start
date to the end date to create events with repetition. The platform’s
calendar works similarly to Google Calendar, where call rotations can
repeat every week, two weeks, three weeks, or one month and can end
their recurrence after one, two, three, six months, one year, or never
end.


Setting up an event:

After selecting the desired dates, the schedule configuration will
appear on the left side of the screen, next to the calendar. In the
settings, you add the start and end times according to the daily
schedule, using the 24-hour format. If the rotation includes night
shifts, include the corresponding night and morning hours, and the
system will automatically distribute the event from one day to the next.

In the “Step Group” field, select the person who will be responsible for incident responses during this shift.

If it is your first time configuring a Call Rotation, you need to
create a Step Group by clicking on the plus sign (+). Next to the field,
choose the first employee for the shift who should be notified. Select
whether they should be notified via SMS, voice call, Telegram, or email
(registered in the platform). Configure the interval time for the alerts
to be sent and how long this first employee should be alerted before
moving to the next step in the rotation.


To add another employee for the shift, click on “Add step” and follow the same steps explained in the previous paragraph.

Tip: Only users with verified mobile numbers and
Telegram IDs in the platform will be available for selection. If an
employee does not appear, it means they need to verify their mobile number for SMS and Voice Call notifications or their Telegram ID for notifications via Telegram. These settings can be configured in the Account” menu”.

If you want an employee to be notified by both SMS and voice call,
add them twice to the Step Group and select the notification method for
each step.

The Step Group configuration is individual for each client and can have as many employees as needed for the shift.


To finish the Step Group configuration, give a name to the created
flow and then click on “Save.” The Step Group will be saved in the Call
Rotation and can be used in more events, following the same flow.

In the Call Rotation settings, you can also choose colors to
differentiate each shift, edit, or delete the Step Group. Once the
dates, times, and employees for the shift are configured, click on
“Create” to register the settings, and the events will appear on the
calendar as shown in the image below:


To enable notifications for the Call Rotation you must validate the
Telegram ID, which is a function for on-call workers and alternate team
schedules. So, each user must individually validate their ID.

To perform this validation, click on “Account” in the side menu of
the platform, and you will access the page with your registration
details. Fill in your name and your phone number in the respective
fields, and then click on “START BOT CONVERSATION.”


You will see a Telegram page, and you will need to log in to your
account to proceed. Click on “SEND MESSAGE” or “OPEN IN WEB,” and then
click on “START” at the end of the conversation page.

In the chat, type /mychatid, and the bot will respond with your ID
number. Copy and paste the number into the Telegram ID field in the
platform, and then click on "Save."

Once you have completed the Telegram ID validation process, you can now proceed to configure Telegram in the Call Rotation.

The Operating Hours feature is designed to allow you to define the days of the week and specific time periods during which your monitoring activities will be active. By configuring the operating hours, you can prevent receiving alerts and notifications during undesired hours, ensuring that your metrics are not impacted during specific timeframes.

This functionality is available for all types of monitoring in the platform and can be manually configured by accessing the application’s information box on its page. Look for the calendar icon to set up and manage the operating hours as per your requirements. This way, you can tailor the monitoring schedule to align with your application’s availability and maintenance periods effectively.


How to configure the operating hours for your monitoring:

  1. Click on the calendar icon in the application’s information box.

  2. A settings window will open, allowing you to choose the days of the week and the specific time periods during which monitoring will be active.

  3. If the operating hours are the same for all days of the week, simply fill in the “Operating hours for all days” field with the start and end times, and then click on “Copy to everyday” to apply the same hours to all selected days.

  4. Once you have finished configuring the operating hours, click on “Save operating hours” to save your settings.

By setting up the operating hours, you can ensure that monitoring activities are scheduled as desired, helping you avoid receiving alerts and notifications during unwanted times while maintaining the monitoring of your application during the specific timeframes you require.


The Operating Hours will automatically start at the chosen time and day. To confirm that it is set up correctly, check if the calendar icon displays a green dot, indicating that the configuration is active. If you need to edit, delete, or confirm the settings, click on the calendar icon again.

If you need the application to be in maintenance mode during a time when it is supposed to be active, you can manually enable maintenance mode by toggling the “Active Monitoring” switch in the application’s information box. If you activate monitoring manually in this way, the application will only be inactive during the scheduled Operating Hours, as specified in the settings.


Warning: If you don’t configure the operating hours for your application, the platform will monitor it 24/7 by default.

In the side menu, click on Environment.

Click on New, select the Cloud, fill in the Name and Tag. Then click on Save.

Click on the icon 

Select the Operational System tab then select from the available operating systems (Amazon Linux, CentOS 7 and 8 or Ubuntu) which one you want to install the agent

After selecting the system, a box will appear, containing the code designated by the platform for custom cloud installation selected. GitHub must be installed on the system operational. Copy and paste the code into the desired system and once the installation is complete, continue configuring the monitoring.

To register users on the One Platform already with specific roles, follow the next steps.

In the Google Admin Panel, click on “Directory” > “Users“.


Within the “Users” tab, click on “More options” > “Manage Custom Attributes“.


Click on “Add Custom Attribute“.


Within the fields “Category” and “Custom Field” > “Name“, you need to follow the standard below.

Category: ElvenworksIntegration
Custom Field:
Name: OnePlatformRole

Type: text

Visibility: Visible to user and admin
Number of values: Single value

After this configuration, go back to the users tab and click on the user to whom you would like to assign a ROLE.

Click on "User Information".

Within the "ElvenworksIntegration" field, type the ROLE you would like to assign to the user.
Available Roles:
- member
- admin
- owner

After that, click on "Save". Within 20 minutes, the ROLE will be applied to the One Platform.

In the platform menu, under the “Teams” option,we can configure communication channels where you want to receive our notifications.
Each team can have different notification channels and we support notifications via webhook.
To configure notifications, select “Teams”. To create a new team, click on the “New” button located at the upper right corner of the screen and follow the setup process.
For registered teams, navigate to the desired team and click on the “Notifications” tab in the top toolbar. Check the box next to the option with the webhook icon, then enter the URL.

Next to the Webhook option, there is a field to enter the url and then the “TEST” button that sends a test to the configured url.

When the webhook notification test is performed, the POST sent to the webhook is done from the browser itself. Browsers use CORS to avoid security problems when a website makes requests to other domains.

Due to the CORS policy, the browser first sends an OPTIONS request to the webhook before sending the POST request. This is to verify if the server responds with headers that comply with the CORS policy. Therefore, for the test to succeed, your webhook must have CORS enabled

Notification via webhook sends a POST request to the specified address, with a payload in the following format:


					 {
"type": "hit/fail",
"title": "Site",
"description": "Could not get IP address for domain https://site.com, lookup site.com on 10.40.0.2:53: no such host",
"status": "alarmed",
"uid": "",
"failure_happened_at": "2024-02-29T13:11:16.398102Z",
"incident_resolved_at": "2024-02-29T13:11:17.311918Z",
"status_page_id": 0,
"status_page_url": "",
"org_uid": "a6bf25a0-0c35-49a9-817f-1bc1d1b6cb89",
"addon_id": 0,
"addon_name": "",
"application_id": 158,
"application_name": "Site",
"product_id": 1,
"product_name": "",
"affectedByIssue": null,
"addon_pool": null,
"incident_id": 1,
"incident_type": "hit/fail",
"incident_data": null,
"severity": "not-classified"
}


After this, you can be notified via webhook when an incident is opened, linking this team.

In the “Teams” option in the platform menu, we can configure
communication channels where we want to receive notifications. Each team
can have different notification channels. We offer support for
notifications through Microsoft Teams in a private chat or a channel.

To set up notifications, click on “Teams.” If you want to create a
new team, click the “New” button in the top right corner of the screen
and follow the setup process.

For already registered teams, access the desired team and click on
the “Notifications” tab in the top bar. Check the checkbox for the
option that has the Microsoft Teams icon, and then click on “Integration
instructions.”


A message box will open with the instructions that need to be executed in the application.


Click on “incoming webhook
connector details,” and a tab will open in your Microsoft browser. You
must be registered in Microsoft Teams to proceed with the configuration.
If you are not already logged in, you will be prompted to log in before
proceeding with the setup.


Click on “Add to a team,” select the channel or team, and click on “Configure a connector.”


Then, a pop-up will open in your Microsoft tab.


Insert the name “e.g. One Platform” in the available field, as shown
in the image above. Click on “Create,” copy the generated URL, and then
click on “Done.” If the tab does not close automatically, you can
manually close the tab and return to the platform tab where we started
the configuration.

Paste the URL copied from the previous step into the “webhook URL”
field available below item 2, and finish by clicking on “Done.” Then,
the required field for notifications via Microsoft Teams will be
automatically filled.


Click on “Save” to finish, and the configuration is now complete. You
will receive a confirmation message in the chosen channel or team in
Microsoft Teams to ensure that the connection was successful.

When you create an organization, the platform will provide a default
cloud provider for external monitoring and webhooks. The following
tutorial is necessary if you want to monitor your product with internal
monitoring.

First, you need to set up the cloud provider. To do this, go to the
left-hand menu and click on “Clouds.” Then, click the “New” button
located in the upper right corner. Select the cloud provider from the
available options: AWSAzure, or Custom. Once you have selected the desired provider based on your needs, additional settings will appear.

AWS Configuration:


Azure Configuration: 


After filling in the required information for each provider, name the
cloud you are configuring. The name of the cloud does not need to be
associated with your product’s name.

The Lead Time for Changes is a Dora Metric that
aims to measure the speed of code or software deployment, from the
closure of a product release to its arrival in the production
environment. This metric helps to better understand the cycle of
solutions created by your team, ensuring that they are executed as
quickly as possible.

To measure the speed, it’s essential to know when the demand was
identified and the time invested in its execution. In addition to
helping reduce the response time to fix issues in an application, the
Lead Time for Changes facilitates the automation of implementation and
improves the release process. Organizing smaller and more frequent
releases tends to continuously improve quality. A Lead Time occurs when a
merge is performed on the target branch, when this occurs it looks at
all the commits that are in the merge and checks the range of the merge
date with the date of the oldest commit. This is for each merge event
carried out in the target branch. The platform displays the simple
average of the last 30 days (total sum of Lead Times / number of Lead
Time).

To set up the Lead Time for Changes metric in the One Platform, follow these steps:

  1. Access the integrations page, located in the left sidebar menu under the “Integrations” tab.
  2. Choose whether you want to integrate via Github or Bitbucket.
  3. Click on “Install new integration” to initiate the integration process.


After clicking to install the new
integration, the window will be redirected to Github. You’ll need to log
in to your Github account, and once you are logged in, choose an
organization to install our application. It’s essential to note that
currently, we only offer compatibility with Github organizations, and
personal accounts will not work for this integration.


After choosing the organization, a configuration screen will be
displayed. You can choose to install the application in all repositories
by selecting “All repositories” or opt to install it in specific
repositories by choosing “Only select repositories.” If you decide to
select repositories


Once you have chosen the best
option for you, click on “Install.” After installing our application on
Github, you will be redirected to the integration screen, where you can
connect applications with repositories.


Connecting applications with repositories:

To associate a repository in your organization with an application,
click on the green button called “Connect application” and you will be
directed to a configuration screen. Here, you need to follow these
steps:

  1. Choose the product to connect with the application in the “Choose product” field (optional)
  2. Select the application within this product in the “Choose application” field.
  3. Choose the integration to be used in the “Choose integration” field.
  4. Select the repository of the chosen integration that you want to
    associate with this application in the “Choose repository” field. Note
    that it is one repository per application.

After making choices in these fields, you need to specify the target
branch. Selecting the target branch is essential because it must be the
main branch of the repository, usually called “main” or “master”. The
platform will receive pull requests that will be merged into this
agency, and this is where Lead Times for Changes will be calculated.
When combining this branch, make sure it looks exactly as it appears on
Github.

After completing the configurations, click “Complete integration” to
finalize the connection between the application and the chosen
repository.

Once you’ve completed the configurations, click on “Finish
integration” to finalize the connection between the application and the
chosen repository.


 The value of the Lead Time for
Changes will appear on the page of the associated application within the
chosen product. You can find this value, calculated based on the last
30 days, in the last box on the right side of your screen.


To unlink an application, follow these steps:

  1. Go to the desired associated application.
  2. Click on the button with the pencil icon to enter the edit mode, and a editing box will appear.
  3. Look for the application you want to unlink within the editing box.
  4. Click on the button with the trash bin icon next to the application you want to unlink.
  5. After the confirmation prompt appears, click on “Delete connection” to unlink the application.


Deleting the integration can be done directly through github, click the button with this you will be redirected to github, go down the page, in Danger zone click on Uninstall 


Scroll to Top